Use GWS with Python
If you are using Python, you may want to check out our GPlates Web Service Python client at https://github.com/michaelchin/gwspy.
The code snippet below demonstrates how to reconstruct three locations back to 100Ma using "Muller2019" model. You need "gwspy" and "shapely" to run the code.
# pip install gwspy# pip install shapelyimport shapelyfrom gwspy import PlateModel, reconstruct_shapely_pointslats = [50, 10, 50]lons = [-100, 160, 100]points = [shapely.Point(x, y) for x, y in zip(lons, lats)]model = PlateModel("Muller2019")paleo_points = reconstruct_shapely_points(model, points, 100) # 100 Maprint(paleo_points)
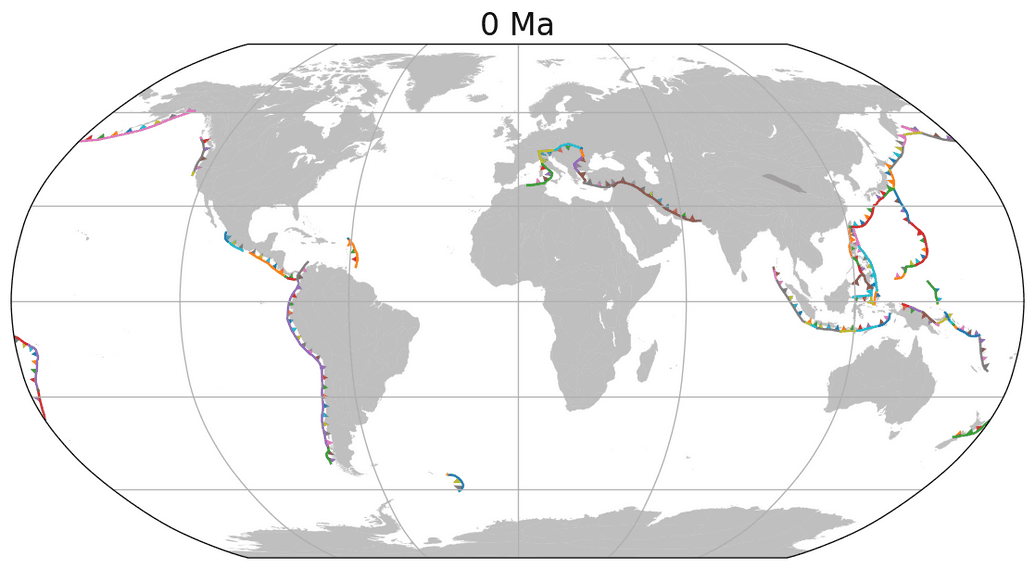
Here is another example. The subduction zones and coastlines in the image below was plotted by plot_subduction_zones.py.
More Python examples can be found at https://github.com/michaelchin/gwspy/tree/main/examples#readme and https://github.com/GPlates/gplates-web-service/tree/master/examples.
